Frametime stuttering/lag after Old Gods update

My setup:

13900k
ASUS 4090
Dell 240hz monitor
Samsung 990pro Nvme ssd
32GB 6400 Mts RAM
ASUS Z790 MOBO

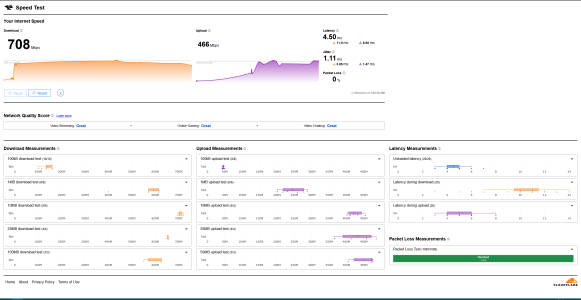
My internet is like 700/700 wired connection.

My game has ran without any issues since forever. Now with the Old Gods update, my game does not run good at all.

I have tried to play with every graphic setting available in the game and outside of the game. I tried messing around with NVCP without any luck. I used four different drivers and same thing is happening. Currently on version 591.67. I verified the integrity of the Deadlock files, reinstalled the game.

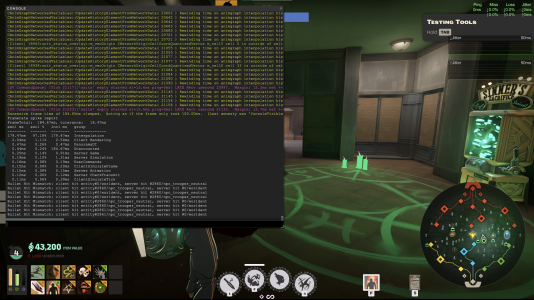
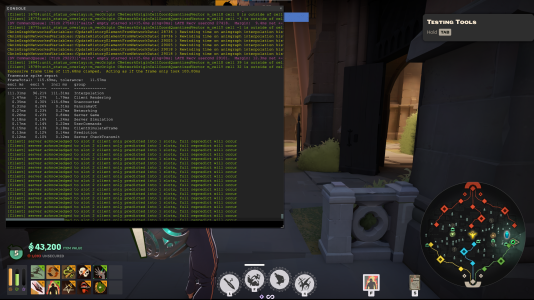
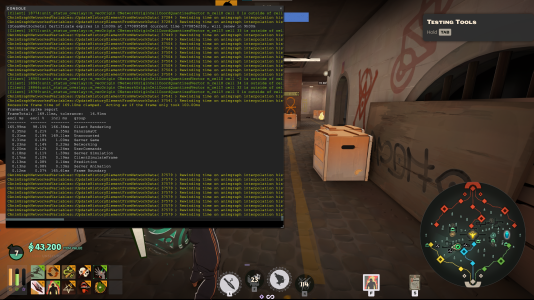
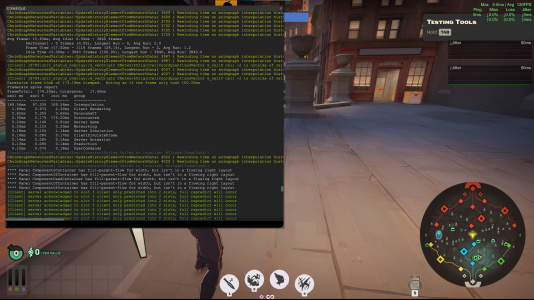
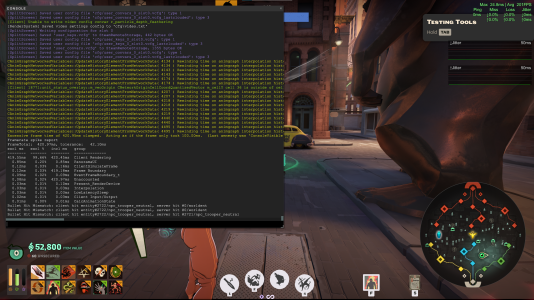
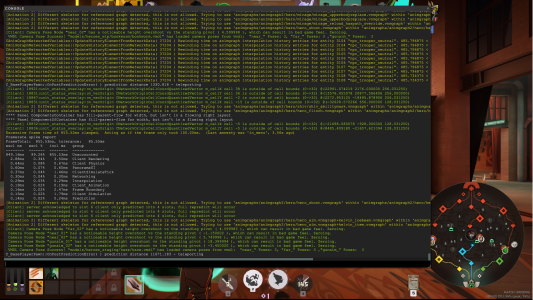
This is how it goes. I start a match, play a bit and my framtime graph goes nuts. It jumps from a stable 2-4ms to 50ms+. It happens throughout the game. Doesn't matter if I am in a teamfight or just running around. I tried in brawl aswell.

I thought this was because of the E-cores the 13900k has so I disabled them via the task manager but it didn't help. So I used Process Lasso to do the same thing to be sure and the frame time drops still persisted.

I used LatencyMon to monitor the latency of my drivers and executables in the background during a match and nothing stood out. I also tried playing without any peripherals bar my keyboard and mouse.

So did anything happen engine side with this update? The game ran so good for almost 2k hours for me. Now I can barerly play one game without just not wanting to play.

The only option that I know of that is left to me is disabling C-states via BIOS, but I'd rather not do that. I will try it later for a game or two.

Some match ids for replays if you want to see the frametime issues from my POV:

56584711: me as Venator
57014793: me as Haze

If you have any ideas, tips or solutions. Please do comment.
 
Last edited:
Added some screenshots from a test game in NYC.

Edit: This was with DirectX11. Same thing happens with Vulkan. Added two Vulkan screenshots.
 

Attachments

  • frametime_report_2.png
    frametime_report_2.png
    2.8 MB · Views: 24
  • frametime_report_3.png
    frametime_report_3.png
    2 MB · Views: 16
  • frametime_report_4.png
    frametime_report_4.png
    2.4 MB · Views: 7
  • frametime_report_1.png
    frametime_report_1.png
    2.4 MB · Views: 7
  • vulkan_test_1.png
    vulkan_test_1.png
    2.4 MB · Views: 5
  • vulkan_test_2.png
    vulkan_test_2.png
    2.5 MB · Views: 6
Last edited:
So after the small updates and the release of Apollo, I tried verifying the files again and deleting the Nvidia cache.

After playing around a bit in training, the name of the frametime stutters has changed in the dev console.

Now I am getting these errors:

[SV CommandQueue] [Tick 6609]['saltx' empty starved x2=31.2ms ping=0ms] LATE Recv usercmd 6430. Margin: 13.0ms net +-2 queue =-18.3 total
[SV CommandQueue] [Tick 6609]['saltx' empty starved x2=31.2ms ping=0ms] LATE Recv usercmd 6431. Margin: 12.5ms net +-1 queue = -3.1 total
 
[SV CommandQueue] [Tick 19203]['saltx' empty starved x3=46.9ms ping=0ms] LATE Recv usercmd 19029. Margin: 6.5ms net +-3 queue =-40.4 total
[SV CommandQueue] [Tick 19203]['saltx' empty starved x3=46.9ms ping=0ms] LATE Recv usercmd 19030. Margin: 5.9ms net +-2 queue =-25.3 total
[SV CommandQueue] [Tick 19203]['saltx' empty starved x3=46.9ms ping=0ms] LATE Recv usercmd 19031. Margin: 5.4ms net +-1 queue =-10.2 total
[SV CommandQueue] [Tick 19218]['saltx' empty starved x2=31.2ms ping=0ms] LATE Recv usercmd 19045. Margin: 12.5ms net +-2 queue =-18.7 total
[SV CommandQueue] [Tick 19218]['saltx' empty starved x2=31.2ms ping=0ms] LATE Recv usercmd 19046. Margin: 12.1ms net +-1 queue = -3.5 total

From a training game again today

This is a perfect 15.6ms spike which is probably the local engine starving? One full default Windows scheduler quantum (~64hz).


Waiting for a solution.
 
Doing some testing with TimerTool


My settings are:

Tick number
x1 starvation
ping=0
Offline reproduction (training)
240 Hz monitor/237 lock (ingame)
TimerTool test results

TimerTool results when its set to maximum still yield the same line in dev console

[SV CommandQueue] [Tick 7039]['saltx' empty starved x1=15.6ms ping=0ms] LATE Recv usercmd 6800.
Margin: 13.0ms net +-1 queue = -2.6 total
 
Last edited:
Issues still happens every game. Sometimes it's worse.

This game was super bad. This frametime stutter happend like every minute or so.
 

Attachments

  • deadlock_log_2.png
    deadlock_log_2.png
    1.5 MB · Views: 17
Adding more entries from the latest exploring NYC session.

First spike.

[Client] server acknowledged to slot 3 client only predicted into 2 slots, full repredict will occur
[Client] server acknowledged to slot 3 client only predicted into 2 slots, full repredict will occur
[Client] server acknowledged to slot 3 client only predicted into 2 slots, full repredict will occur
[Client] server acknowledged to slot 3 client only predicted into 2 slots, full repredict will occur
[Client] server acknowledged to slot 3 client only predicted into 2 slots, full repredict will occur
[SV CommandQueue] [Tick 21235]['saltx' empty starved x2=31.2ms ping=0ms] LATE Recv usercmd 21111. Margin: 4.0ms net +-2 queue =-27.3 total
[SV CommandQueue] [Tick 21235]['saltx' empty starved x2=31.2ms ping=0ms] LATE Recv usercmd 21112. Margin: 3.5ms net +-1 queue =-12.1 total
Bullet Hit Mismatch: client hit entity#0/worldent, server hit #2733/npc_trooper_neutral
[SV CommandQueue] [Tick 21427]['saltx' empty starved x1=15.6ms ping=0ms] LATE Recv usercmd 21304. Margin: 12.7ms net +-1 queue = -2.9 total
Excessive frame time of 125.51ms clamped. Acting as if the frame only took 100.00ms. (Last amnesty was 'SDL_EVENT(0x20e)', 4.60s ago)
Framerate spike report
FrameTotal: 125.52ms, tolerance: 12.55ms
excl ms excl % incl ms group
-------- ------- -------- --------------
119.81ms 95.45% 119.81ms Interpolation
1.60ms 1.27% 2.32ms Client Rendering
0.95ms 0.75% 0.95ms PanoramaUI
0.71ms 0.56% 125.52ms Unaccounted
0.31ms 0.25% 0.95ms Server Game
0.23ms 0.19% 0.47ms Networking
0.20ms 0.16% 1.35ms Server Simulation
0.15ms 0.12% 0.18ms ClientSimulateFrame
0.15ms 0.12% 0.18ms UserCommands
0.15ms 0.12% 0.39ms ClientSimulateTick
0.15ms 0.12% 0.15ms Server Animation
[Client] 18740:unit_status_overlay::m_vecOrigin CNetworkOriginCellCoordQuantizedVector m_cellY cell -2 is outside of cell bounds (0->32) @(722.970215 -19026.931641 512.031250)
Bullet Hit Mismatch: client hit entity#2732/npc_trooper_neutral, server hit #0/worldent
Bullet Hit Mismatch: client hit entity#2731/npc_trooper_neutral, server hit #0/worldent
[Client] server acknowledged to slot 3 client only predicted into 2 slots, full repredict will occur
[Client] server acknowledged to slot 3 client only predicted into 2 slots, full repredict will occur
[Client] server acknowledged to slot 3 client only predicted into 2 slots, full repredict will occur

Second spike

Client] server acknowledged to slot 3 client only predicted into 2 slots, full repredict will occur
[Client] server acknowledged to slot 3 client only predicted into 2 slots, full repredict will occur
CAnimGraphNetworkedVariables::UpdateHistoryElementFromNetworkData( 25840 ) Rewinding time on animgraph interpolation history entries for entity 2490 "npc_trooper_boss". 403.671875 < 403.750000
CAnimGraphNetworkedVariables::UpdateHistoryElementFromNetworkData( 25979 ) Rewinding time on animgraph interpolation history entries for entity 2663 "npc_trooper_neutral". 7.421875 < 405.921875
[Client] 18741:unit_status_overlay::m_vecOrigin CNetworkOriginCellCoordQuantizedVector m_cellX cell -19 is outside of cell bounds (0->32) @(-36085.710938 -4806.281250 512.031250)
Excessive frame time of 582.49ms clamped. Acting as if the frame only took 100.00ms. (Last amnesty was 'SDL_EVENT(0x20e)', 3.52s ago)
Framerate spike report
FrameTotal: 582.50ms, tolerance: 58.25ms
excl ms excl % incl ms group
-------- ------- -------- --------------
578.26ms 99.27% 578.26ms Interpolation
1.32ms 0.23% 1.64ms Client Rendering
0.34ms 0.06% 582.50ms Unaccounted
0.31ms 0.05% 0.31ms PanoramaUI
0.26ms 0.04% 0.83ms Server Game
0.21ms 0.04% 0.24ms ClientSimulateFrame
0.21ms 0.04% 0.21ms Networking
0.18ms 0.03% 1.21ms Server Simulation
0.16ms 0.03% 0.19ms UserCommands
0.14ms 0.02% 0.14ms Server Animation
0.13ms 0.02% 0.14ms Prediction
CAnimGraphNetworkedVariables::UpdateHistoryElementFromNetworkData( 25992 ) Rewinding time on animgraph interpolation history entries for entity 2660 "npc_trooper_neutral". 7.421875 < 406.125000
[Client] 18738:unit_status_overlay::m_vecOrigin CNetworkOriginCellCoordQuantizedVector m_cellY cell 42 is outside of cell bounds (0->32) @(-6517.328613 27018.671875 512.031250)
CAnimGraphNetworkedVariables::UpdateHistoryElementFromNetworkData( 26006 ) Rewinding time on animgraph interpolation history entries for entity 2661 "npc_trooper_neutral". 7.468750 < 406.343750
[Client] 18745:unit_status_overlay::m_vecOrigin CNetworkOriginCellCoordQuantizedVector m_cellX cell -3 is outside of cell bounds (0->32) @(-19596.957031 -896.000000 384.031250)
 
Jumping in to say I'm experiencing the same since the Old Gods update, unfortunately. I haven't done enough tracking, will update my own post with logs. Appreciate the diligence orbital.

Same CPU.

Setup:
i9 13900k
3090 20gb
240hz monitor
Nvme ssd
2x 32GB 6400 Mts RAM
ASUS z790 Elite AX
WIN10

What I've tested:
Every in-game setting under the sun
-Full screen seems marginally better than borderless for stutter
-Switching graphics API (toggling vulkan/dx11)
-Capped FPS at multiple intervals

Verified integrity multiple times
Deleted shadercache in Roaming
Disabled Full Screen optimizations, seems to help marginally
 
Should I do a PerfView log and post it?

You should, but don't post it publicly as it may contain sensitive information.

Follow the instructions given by this Valve developer:
 
A short video from exploring NYC. Taken with the Steam Recording.

I go over my video settings and then I run around NYC for a bit. You can clearly see the stuttering. I will also open the console so you can see when it happens. Video was recorded in 2560x1440, 60fps but I had to compress it to share here.
 

Attachments

There was a small patch some time ago. It feels like it broke even more.

This is me from idling in explore NYC. These errors happen back to back.

[SV CommandQueue] [Tick 2928]['saltx' empty starved x3=46.9ms ping=0ms] LATE Recv usercmd 2793. Margin: 3.8ms net +-3 queue =-43.0 total
[SV CommandQueue] [Tick 2928]['saltx' empty starved x3=46.9ms ping=0ms] LATE Recv usercmd 2794. Margin: 3.5ms net +-2 queue =-27.8 total
[SV CommandQueue] [Tick 2928]['saltx' empty starved x3=46.9ms ping=0ms] LATE Recv usercmd 2795. Margin: 3.2ms net +-1 queue =-12.4 total
[SV CommandQueue] [Tick 3243]['saltx' empty starved x2=31.2ms ping=0ms] LATE Recv usercmd 3109. Margin: 12.5ms net +-2 queue =-18.8 total
[SV CommandQueue] [Tick 3243]['saltx' empty starved x2=31.2ms ping=0ms] LATE Recv usercmd 3110. Margin: 12.1ms net +-1 queue = -3.6 total
Excessive frame time of 130.30ms clamped. Acting as if the frame only took 100.00ms. (Last amnesty was 'ConsoleVisible', 3.75s ago)
Framerate spike report
FrameTotal: 130.32ms, tolerance: 13.03ms
excl ms excl % incl ms group
-------- ------- -------- --------------
129.19ms 99.14% 129.55ms Client Rendering
0.34ms 0.26% 0.34ms PanoramaUI
0.25ms 0.19% 0.36ms Prediction
0.11ms 0.08% 0.48ms Client Input/Output
0.09ms 0.07% 0.10ms ClientSimulateFrame
0.08ms 0.06% 130.32ms Unaccounted
0.06ms 0.04% 0.06ms EventFrameBoundary_t
0.05ms 0.04% 0.05ms Animation
0.05ms 0.04% 128.81ms Frame Boundary
0.04ms 0.03% 0.04ms Interpolation
0.02ms 0.02% 0.02ms Movement
Excessive frame time of 166.29ms clamped. Acting as if the frame only took 100.00ms. (Last amnesty was 'ConsoleVisible', 1.18s ago)
Framerate spike report
FrameTotal: 166.31ms, tolerance: 16.63ms
excl ms excl % incl ms group
-------- ------- -------- --------------
165.54ms 99.54% 165.90ms Client Rendering
0.34ms 0.20% 0.34ms PanoramaUI
0.10ms 0.06% 165.23ms Frame Boundary
0.10ms 0.06% 0.12ms ClientSimulateFrame
0.07ms 0.04% 166.31ms Unaccounted
0.06ms 0.04% 0.07ms EventFrameBoundary_t
0.03ms 0.02% 0.03ms Client Input/Output
0.02ms 0.01% 0.02ms Interpolation
0.02ms 0.01% 0.06ms Present_RenderDevice
0.01ms 0.01% 0.01ms CalcAnimationState
0.01ms 0.00% 0.01ms HUD
Avg Frame: 15.69ms, Avg Idle: 0.00ms - 3840 frames
Performant - 0 frames (0.0%), Longest Run - 0, Avg Run: 0.0
Frame Time >17.50ms - 218 frames (5.7%), Longest Run - 2, Avg Run: 1.0
Idle Time <3.00ms - 3840 frames (100.0%), Longest Run - 3840, Avg Run: 3840.0
Excessive frame time of 149.46ms clamped. Acting as if the frame only took 100.00ms. (Last amnesty was 'ConsoleVisible', 1.15s ago)
Framerate spike report
FrameTotal: 149.47ms, tolerance: 14.95ms
excl ms excl % incl ms group
-------- ------- -------- --------------
145.12ms 97.09% 145.18ms Server Physics
1.80ms 1.20% 2.06ms Client Rendering
0.29ms 0.19% 149.47ms Unaccounted
0.25ms 0.17% 0.25ms PanoramaUI
0.22ms 0.15% 0.22ms Networking
0.22ms 0.15% 145.81ms Server Game
0.19ms 0.12% 146.16ms Server Simulation
0.14ms 0.10% 0.15ms Prediction
0.13ms 0.09% 0.13ms Server Animation
0.12ms 0.08% 0.15ms ClientSimulateFrame
0.12ms 0.08% 0.15ms UserCommands
 
Upon entering the game I am met with stutters.


[SV CommandQueue] [Tick 1628]['saltx' empty starved x4=62.5ms ping=0ms] generating substitute command 1408 from 1408
[SV CommandQueue] [Tick 1629]['saltx' empty starved x4=62.5ms ping=0ms] LATE Recv usercmd 1406. Margin: 2.8ms net +-3 queue =-44.1 total
[SV CommandQueue] [Tick 1629]['saltx' empty starved x4=62.5ms ping=0ms] LATE Recv usercmd 1407. Margin: 2.5ms net +-2 queue =-28.8 total
[SV CommandQueue] [Tick 1629]['saltx' empty starved x4=62.5ms ping=0ms] LATE Recv usercmd 1408. Margin: 2.2ms net +-1 queue =-13.4 total
Excessive frame time of 277.97ms clamped. Acting as if the frame only took 100.00ms
Framerate spike report
FrameTotal: 277.99ms, tolerance: 27.80ms
excl ms excl % incl ms group
-------- ------- -------- --------------
276.29ms 99.39% 276.36ms Client Rendering
0.24ms 0.09% 277.99ms Unaccounted
0.17ms 0.06% 0.25ms UserCommands
0.12ms 0.04% 0.13ms Networking
0.11ms 0.04% 0.12ms Prediction
0.10ms 0.04% 0.52ms Server Game
0.09ms 0.03% 0.09ms Server Animation
0.08ms 0.03% 276.17ms Frame Boundary
0.07ms 0.02% 0.67ms Server Simulation
0.06ms 0.02% 0.06ms ClientSimulate_Think
0.06ms 0.02% 0.25ms ClientSimulateTick
Excessive frame time of 330.34ms clamped. Acting as if the frame only took 100.00ms. (Last amnesty was 'FrameRateSpikeDump', 2.68s ago)
Framerate spike report
FrameTotal: 330.35ms, tolerance: 33.03ms
excl ms excl % incl ms group
-------- ------- -------- --------------
330.00ms 99.89% 330.15ms Client Rendering
0.14ms 0.04% 0.14ms PanoramaUI
0.07ms 0.02% 0.07ms EventFrameBoundary_t
0.05ms 0.02% 330.35ms Unaccounted
0.02ms 0.01% 0.04ms ClientSimulateFrame
0.02ms 0.01% 0.02ms Interpolation
0.02ms 0.00% 0.39ms Frame Boundary
0.01ms 0.00% 0.01ms Present_RenderDevice
0.01ms 0.00% 0.01ms Client Input/Output
0.01ms 0.00% 0.01ms CalcAnimationState
0.00ms 0.00% 0.00ms SDL
 
I aggrogated some of @JasperP 's input from the thread linked above - working on a more robust post of my own (as he suggests) but I'll post here in the meantime as I found a pretty big fix, at least for my setup, from Jasper's input.

He says
More tests to try:
1. Does switching to Vulkan in the settings help performance at all? You will need to restart the game after selecting Vulkan.
2. Do the performance issues happen in a bot match, or Explore NYC, or only during live matches?
3. Does toggling the HUD by pressing F7 and typing `citadel_hud_visible 0` improve performance for you?
4. Try adjusting the game's resolution to be lower; does that help improve performance?
7. r_citadel_gpu_culling_two_pass 0
6. You can disable particle effects by typing `r_drawparticles 0` in the F7 console. Does that help your performance issues? You can also try `cl_particle_simulate 0` to freeze particles.

The 3 commands he mentions have largely suppressed stutter on my system in the 5 or so games I've played since using them. I still see jitter occasionally, which leads me to believe there is a larger problem and an even larger optimization patch on the way (yoshiplz), but for now -

Load your hideout, let shaders cache, then execute commands below in console (if you do not let shaders cache and execute commands preemptively, the game will fail to render any and all particles). I should also mention my client really only has issues playing standard online matches. Bot matches run perfectly, even streetbrawl is playable. Every system is different - so, no promises.

cl_particle_simulate 0
r_drawparticles 0
r_citadel_gpu_culling_two_pass 0

citadel_hud_visible 0 (anti compy + hud lag is being tracked elsewhere)
 
Back
Top